

Perfect paydown curves
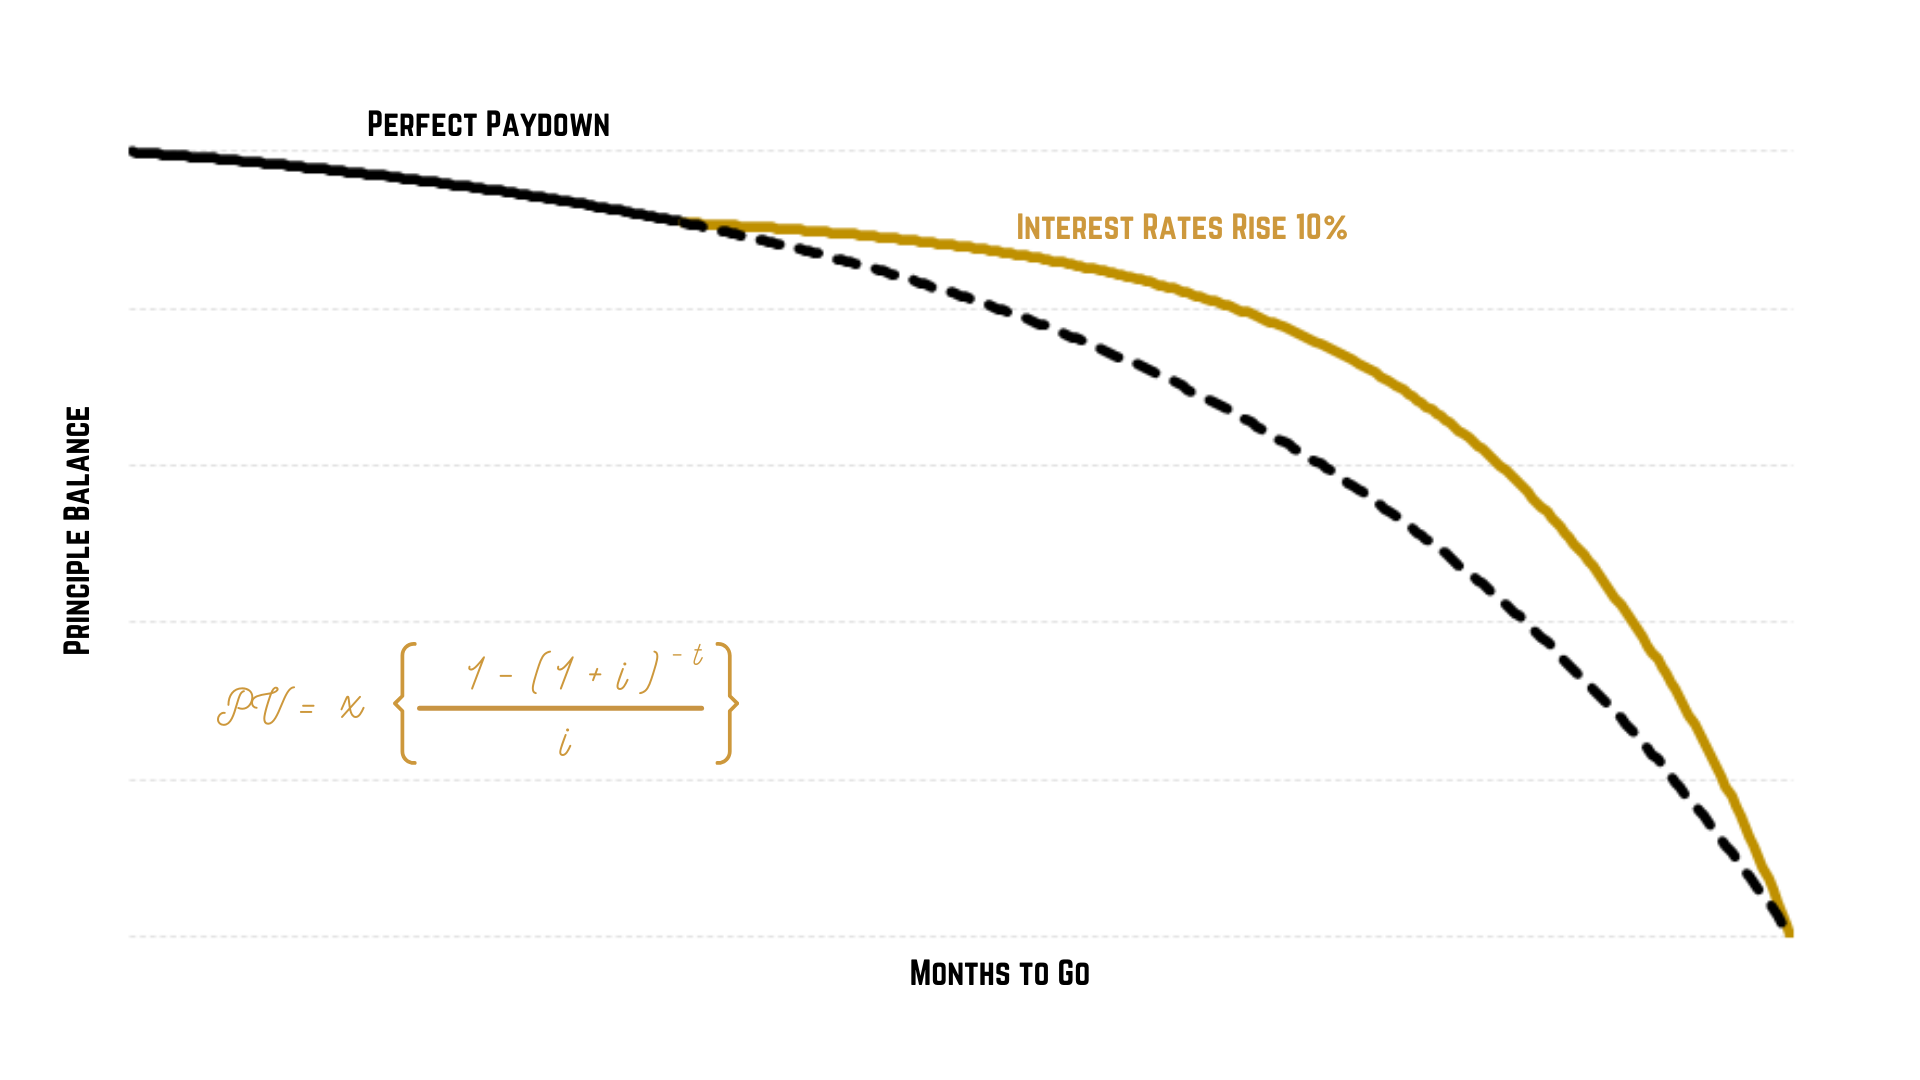
PV = x [ (1 – (1 + i) -t )/ i ]
Where:
PV = the present value of the loan at a given point in time
x = the instalment amount
i = the interest rate
t = the number of terms remaining
You can shuffle this all around as needed, so that: if the PV is lower than the actual balance outstanding, a customer is in arrears (in the old days I had to do this sometimes when we took on portfolios with questionable data hygiene but that’s seldom needed these days); if in collections, you need to reduce the instalment by a certain amount, you can see how many months the loan would be extended by; or, in the affordability context; if you have calculated the maximum monthly instalment and have a set term and price, what the largest affordable loan is.

Affordability versus Risk
A good credit history and money management skills speak to a consumer’s willingness to repay, affordability checks speak to their ability to repay. And, at least in theory, calculating a consumer’s ability to repay a loan should be the simpler of the two tasks, being that ‘ability’ is all about the numbers while ‘willingness’ requires us to get inside the borrower’s head to some extent. Of course, it is not so easy in the real world, but simply put, a consumer is able to repay a loan when they have more money available to meet their debt obligations than they need to keep those obligations up-to-date.

An introduction to champion-challenger
To actually be champion-challenger, it has to drive change, the challenger must be allowed to ascend to the throne. But, and this is perhaps a nuance better captured by the test-and-learn terminology, this has to be done in a controlled, scientific approach.
We don’t actually make a series of complete substitutions of one strategy for another, instead, we’re always running at least two strategies side-by-side. In examples, we often talk about 80% going down the champion stream and 20% going down the challenger but in reality, we set the split based on the degree of risk involved, how much of a variation we’d expect to see, the size of the portfolio and the sophistication of the team managing it. This is all based on statistical sampling theories, and I won’t go into them further in this article.